How to use Kubernetes Dashboard

Kubernetes Dashboard is the web UI that ships with Kubernetes. That is the dashboard we install in this post using kubectl proxy and a token, without using an Ingress controller or authenticating proxy.
Alternative Dashboards
K8Dash
K8Dash is a popular open-source alternative to Kubernetes Dashboard. K8Dash must be exposed publicly on the cluster, requiring an Ingress controller and an authenticating proxy.
Kubevious
Kubevious is a read-only tool for examining Kubernetes clusters.
Octant
Octant is a developer-centric, read-only Kubernetes UI.
Lens
Lens is a desktop application built as a Kubernetes IDE. It is free, easy to install, and automatically reads the Kubeconfig file on your system.
Metrics Server
Most Kubernetes Dashboards give you access to metrics if you install the Metrics Server, described here: Kubernetes Metrics Server.
Installation
Start by following Rancher’s dashboard instructions: Rancher Docs: Kubernetes Dashboard.
Verify that the Kubernetes Dashboard pod is running.
1
2
3
4
5
```shell
pi@pi1:~ $ sudo kubectl get pods --namespace kubernetes-dashboard
NAME                                         READY   STATUS    RESTARTS   AGE
dashboard-metrics-scraper-7b59f7d4df-724pf   1/1     Running   0          12m
kubernetes-dashboard-665f4c5ff-5pbl2         1/1     Running   0          12m
Note the node name above, “kubernetes-dashboard-xxxxxxxxxx-xxxxx.” Yours will be different. You need the name to set-up the kubectl proxy from your desktop.
Verify that the Kubernetes Dashboard Services are running.
1
2
3
4
sudo kubectl get services --namespace kubernetes-dashboard
NAME                        TYPE        CLUSTER-IP      EXTERNAL-IP   PORT(S)    AGE
kubernetes-dashboard        ClusterIP   10.43.135.238   <none>        443/TCP    14m
dashboard-metrics-scraper   ClusterIP   10.43.210.211   <none>        8000/TCP   14m
Congratulations! You now have a working Kubernetes Dashboard. To access the Dashboard from your computer, set up the port forwarding and start the kubeclt proxy, substituting the pod name that you listed above.
1
2
3
4
5
export KUBECONFIG=~/kubeconfig
kubectl --namespace=kubernetes-dashboard port-forward kubernetes-dashboard-665f4c5ff-5pbl2 8443 &
Forwarding from 127.0.0.1:8443 -> 8443
kubectl proxy &
Starting to serve on 127.0.0.1:8001
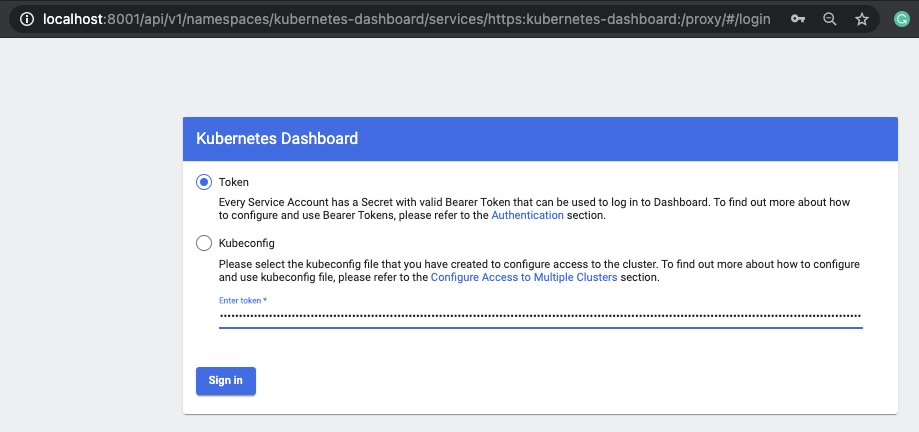
Open a browser and navigate to the Kubernetes Dashboard. Use the admin-user bearer token from above to log in.

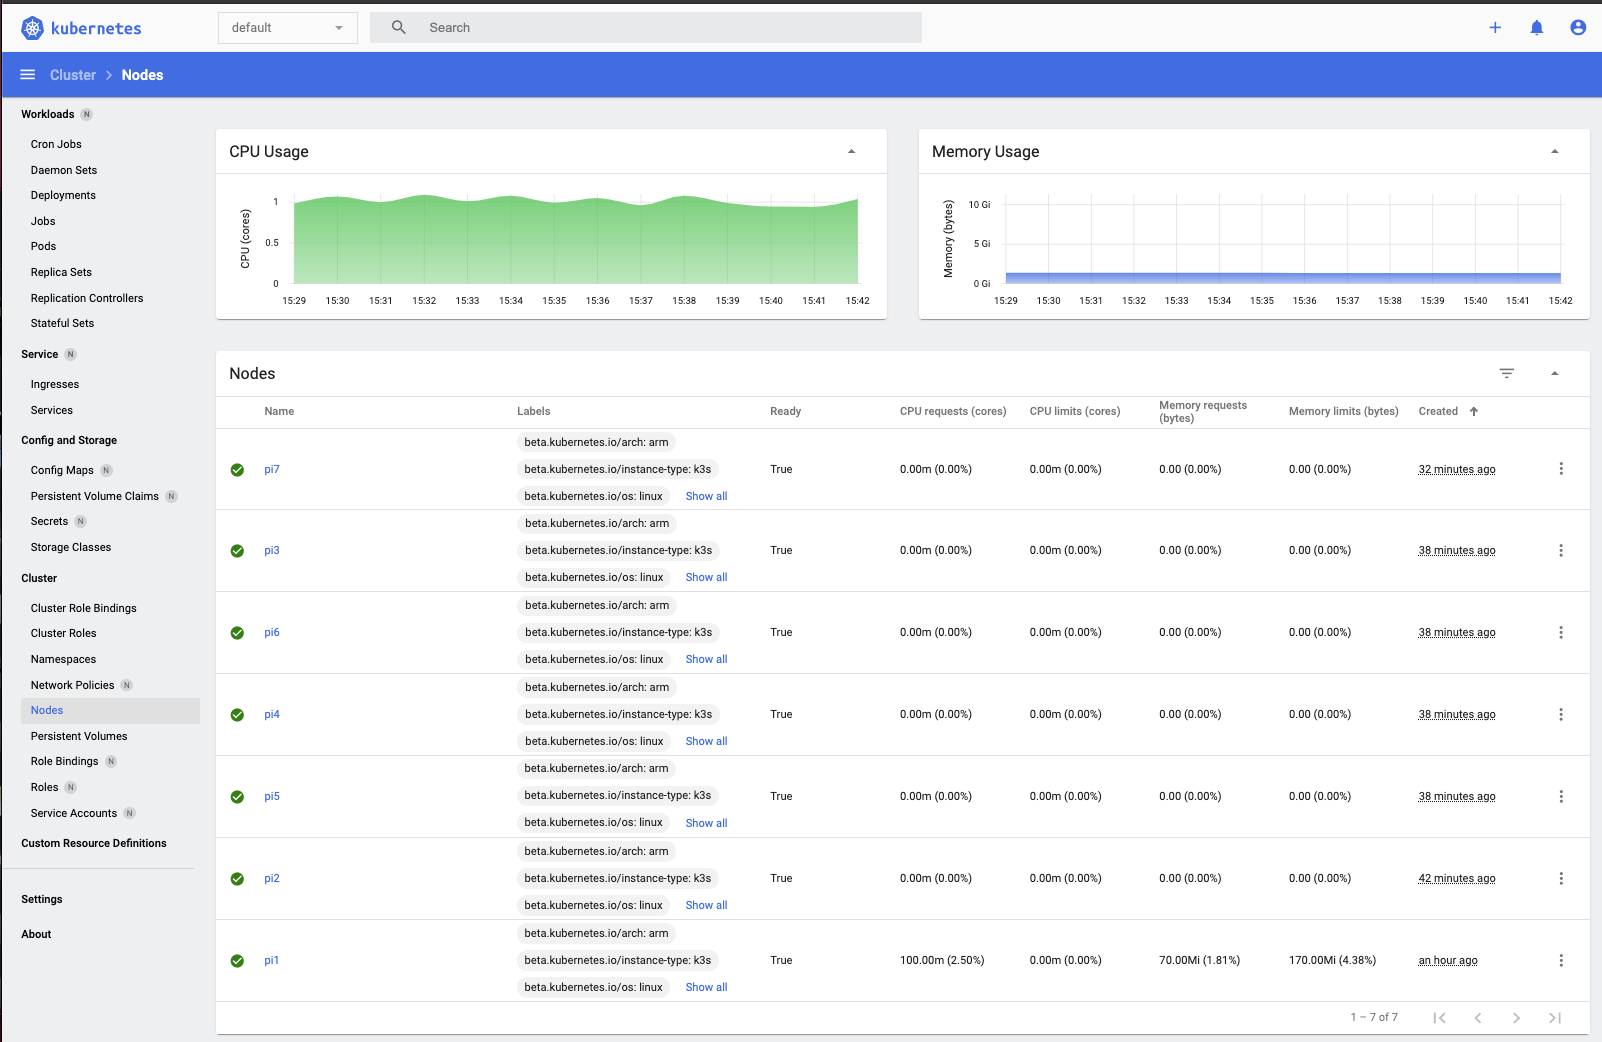
Navigate to the Nodes page to see the agent nodes you just installed.
You can put an authenticating proxy in front of the Kubernetes Dashboard if you don’t want to use kubectl proxy and a token, but that is beyond the scope of this post. See Joe Beda’s post, “On Securing the Kubernetes Dashboard.”